Falling orders
Signals
“Central Gym has cut its orders by 40% in two months and raised two complaints about late deliveries.”
Alert
- Risk
- High
- Main reason
- Delivery complaints
Call from the account manager this week
Use case
A machine learning model spots which customers are most likely to leave and why, so the sales team can act before losing them, not after they have gone.

The problem
They buy a little less each time, complain once or stop logging in to the portal. The signals are in the data, but nobody has time to look at them customer by customer.
Today
With AI
How it works
Purchases, contracts, complaints, service usage and sales contacts.
3 years · 4,200 customers
It learns the patterns of customers who left, using classical machine learning.
Validated against real churn
Every active customer gets a churn probability and the factors that weigh most.
High risk: 38 customers
Human review
The account manager reviews the list, decides the action and logs it in the CRM.
Call, visit or offer
Examples
Sample data from a fictitious supplies company.
Signals
“Central Gym has cut its orders by 40% in two months and raised two complaints about late deliveries.”
Alert
Call from the account manager this week
Signals
“Riverside Clinic has placed no orders in six weeks, having usually ordered every fortnight.”
Alert
Reminder with their usual order
Signals
“A maintenance customer has 60 days left on their contract and is using the portal less.”
Alert
Review meeting before the renewal
Signals the model usually uses
Down to earth
The model learns from customers who left. With very few recorded, the first step is to define clearly what counts as churn.
The model gives probabilities, not certainties. Whoever knows the customer decides whether and how to act.
We compare churn among flagged customers with a control group to find out whether retention is working.
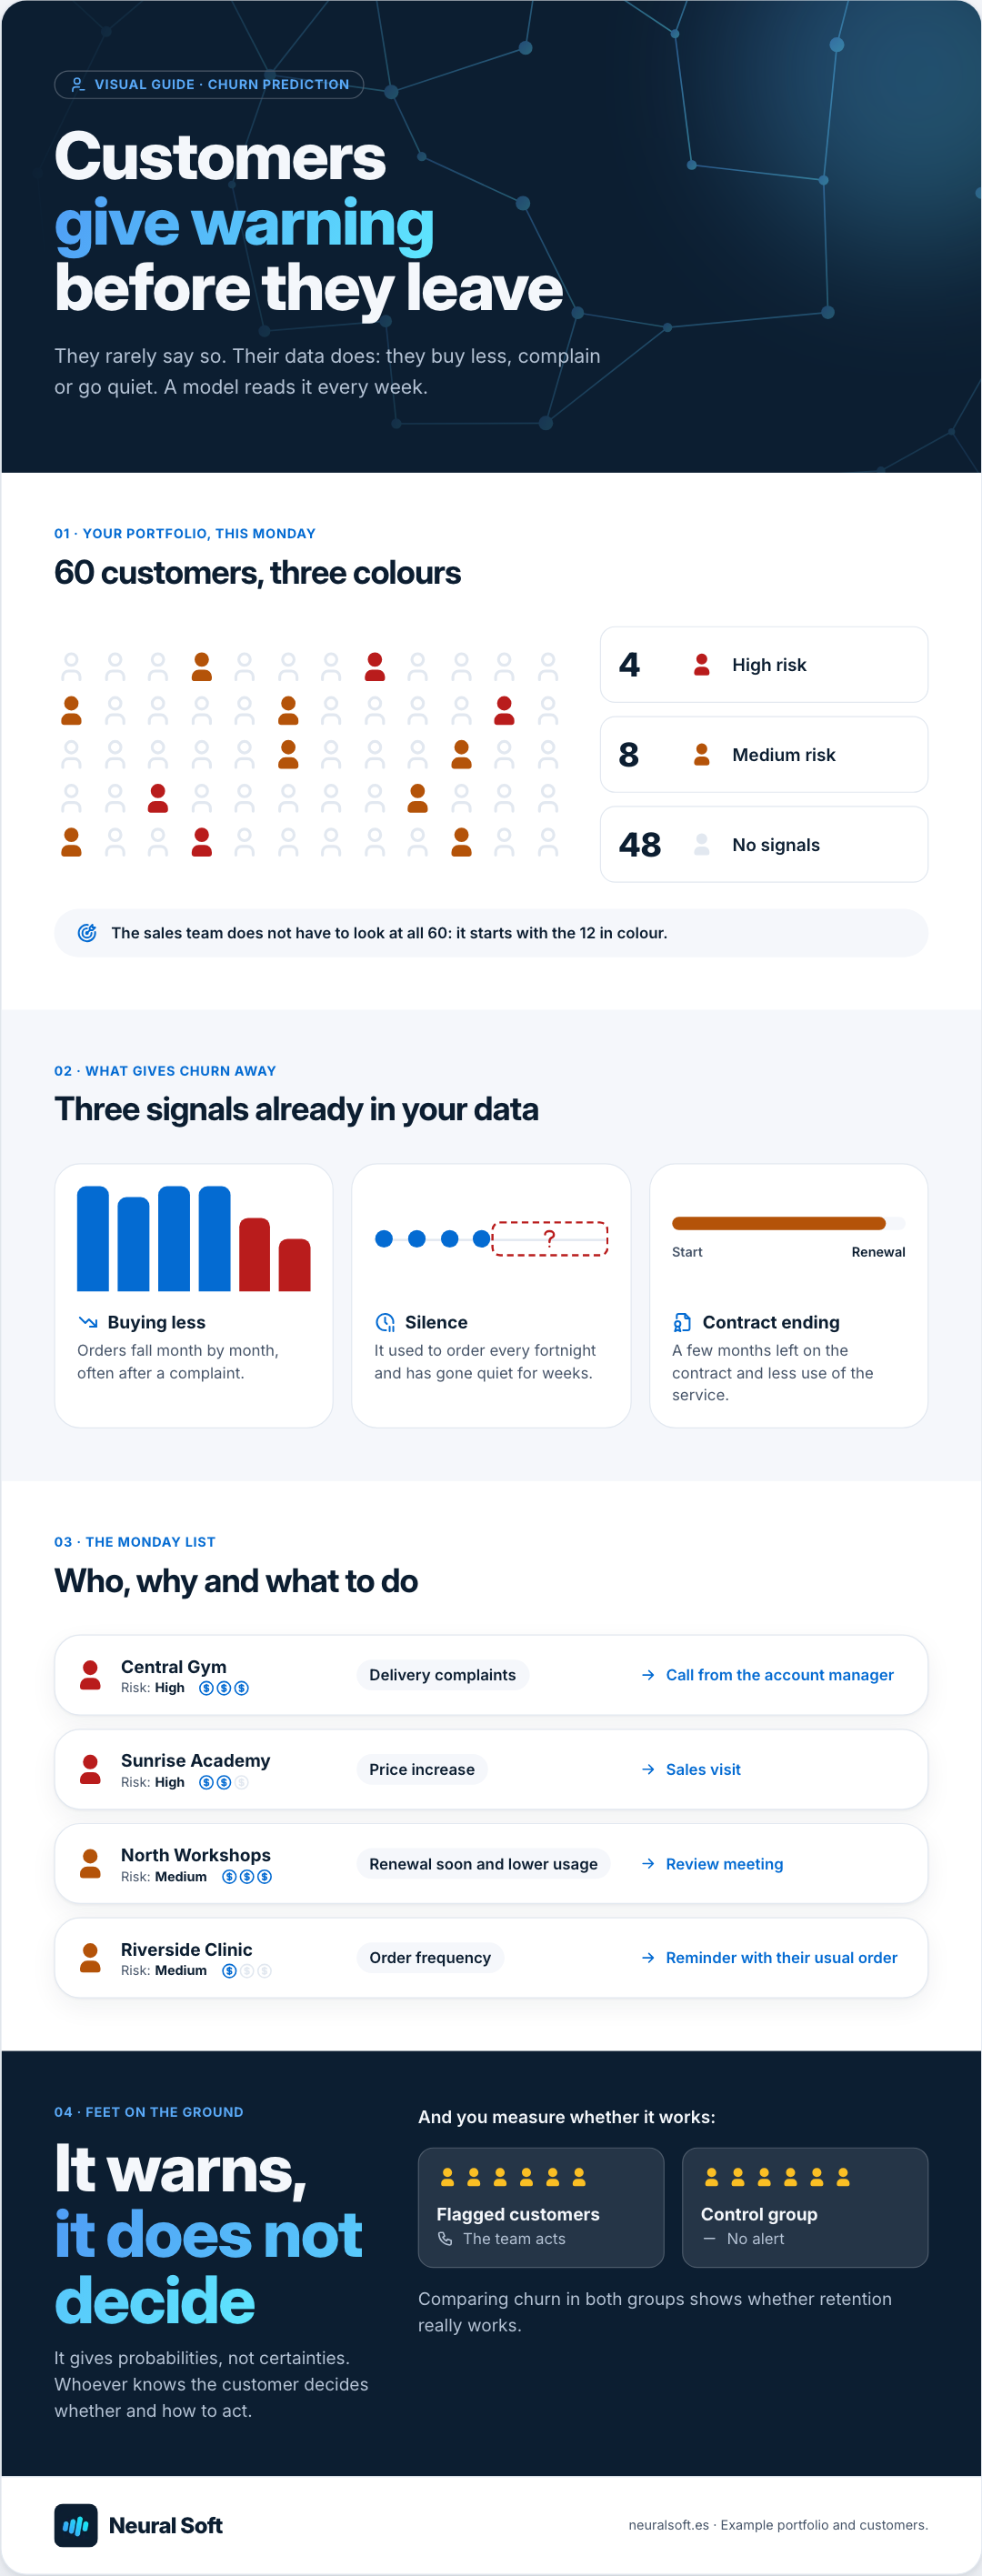
Visual guide · Churn prediction
Customers
give warning
before they leave
They rarely say so. Their data does: they buy less, complain or go quiet. A model reads it every week.
01 · Your portfolio, this Monday
The sales team does not have to look at all 60: it starts with the 12 in colour.
02 · What gives churn away
Buying less
Orders fall month by month, often after a complaint.
Silence
It used to order every fortnight and has gone quiet for weeks.
Contract ending
A few months left on the contract and less use of the service.
03 · The Monday list
04 · Feet on the ground
It warns,
it does not decide
It gives probabilities, not certainties. Whoever knows the customer decides whether and how to act.
And you measure whether it works:
Flagged customers
The team acts
Control group
No alert
Comparing churn in both groups shows whether retention really works.
Loyalty
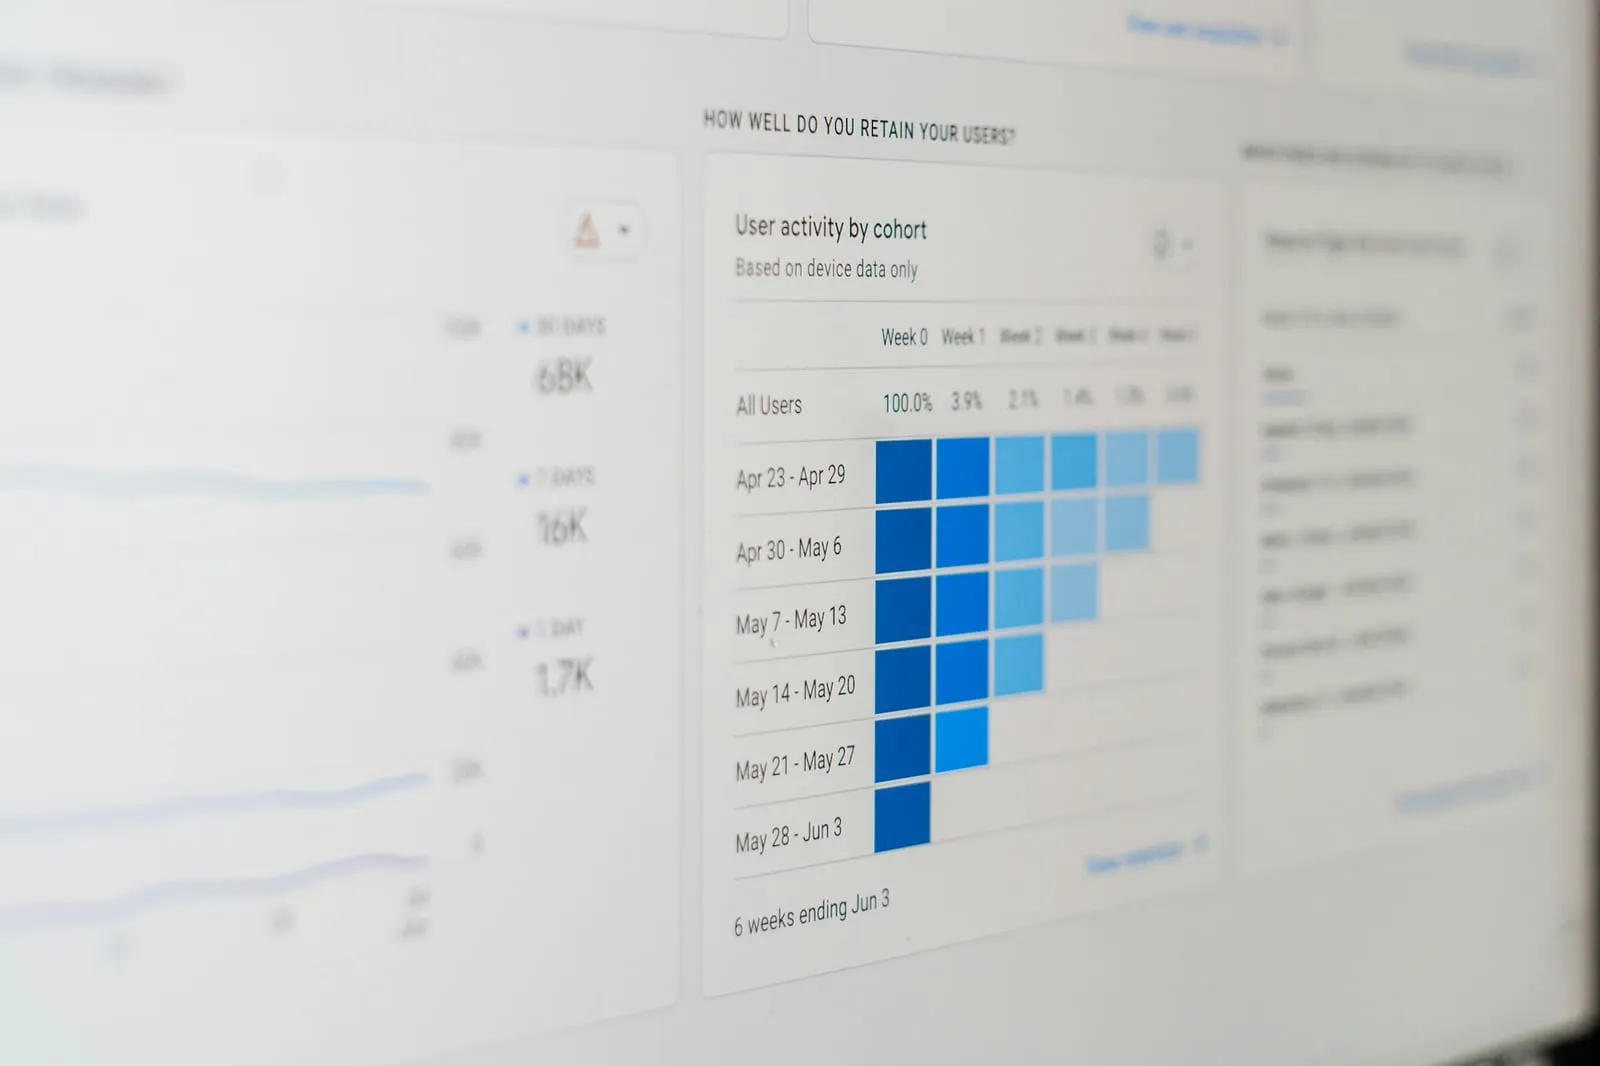
As well as the weekly list, the dashboard shows how retention evolves by customer type, region or product, to spot problems that affect a whole segment rather than one customer.
Method
We agree what churn means for your business and check what data is held for each customer.
Churn definition and data assessment
We train the model and measure whether it would have spotted, in time, the churn in months it has not seen.
Accuracy report on real churn
The list reaches the CRM every week. We measure churn avoided against a control group.
Weekly list and measurement of the effect
We design and build artificial intelligence solutions tailored to your processes, data and tools when an off-the-shelf solution does not fit or falls short.
Real predictive models, from the data to evaluation and interpretation.
More time selling and less time preparing, with AI as your sales assistant.
Tell us what kind of customers you have, how they buy and where their data is kept. We will tell you whether there is enough information for a churn prediction model.
May we measure visits?
We use Google Analytics to see which pages are visited. Its cookies are only set if you accept; if you decline, Google only receives cookieless signals. You can change this at any time from the footer. Cookie policy